
Semaphorin 6A–Plexin A2/A4 interactions with radial glia regulate migration termination of superficial layer cortical neurons.
Yumiko Hatanaka, Takahiro Kawasaki, Takaya Abe, Go Shioi, Takao Kohno, Mitsuharu Hattori, Akira Sakakibara, Yasuo Kawaguchi & Tatsumi Hirata
iScience 21, pp 359-374, 2019 DOI:10.1016/j.isci.2019.10.034
Precise regulation of neuronal migration termination is crucial for the establishment of brain cytoarchitectures. However, little is known how neurons terminate migration. We found that superficial layer cortical neurons (SLNs) migrate beyond their final destination and ectopically invade layer 1 in Plexin (Plxn) A2/A4 double-knockout mice as well as Semaphorin (Sema) 6A knockout mice. Cell-targeted gene expression and conditional knockouts indicated that Sema6A on radial glial cells and PlxnA2/A4 on SLNs are involved in this process. Given that Sema6A–PlxnA2/A4 trans-interactions generally induce a repulsive reaction, our results suggest that Sema6A–PlxnA2/A4 interaction elicits repulsion and weakens migrating neuron–substrate interactions, leading to migration termination.
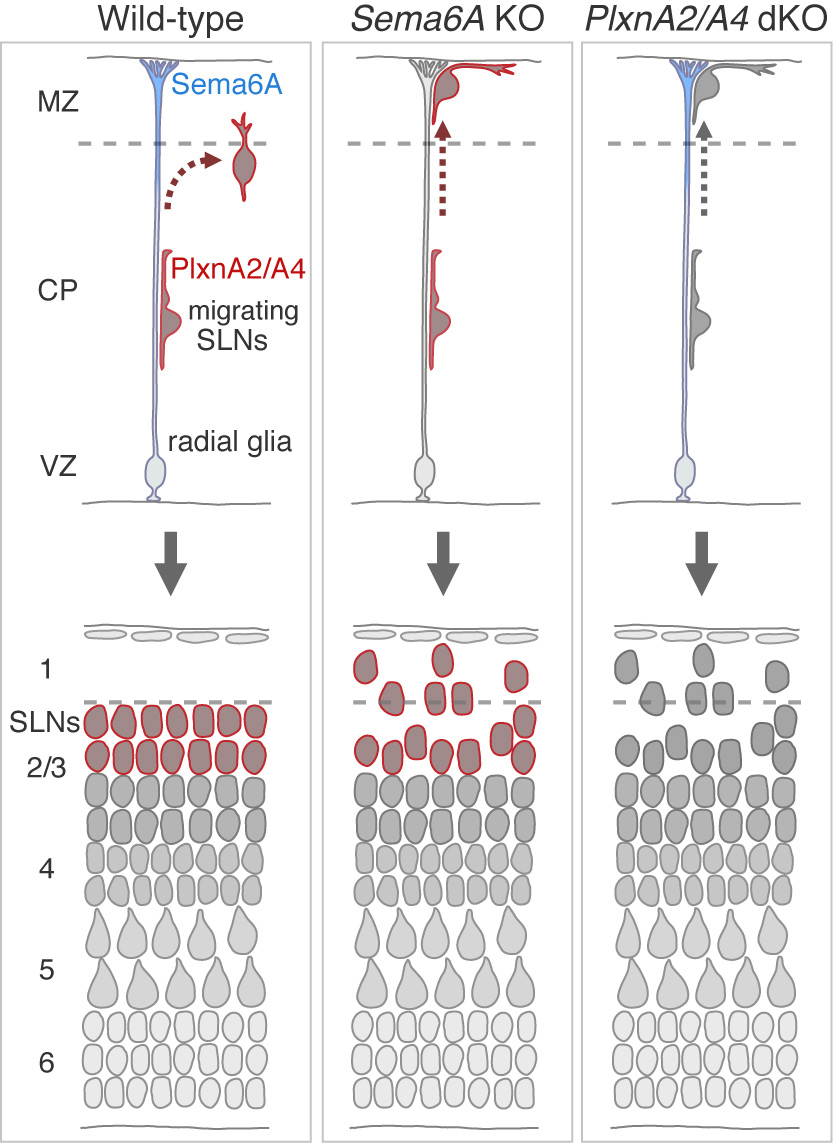
Figure: Cortical neurons migrate toward the pial surface along radial glial cell fibers. Sema6A on radial glial cells and PlxnA2/A4 on migrating neurons are necessary for proper migration termination of superficial layer cortical neurons.
Press release
A novel katanin-tethering machinery accelerates cytokinesis
Takema Sasaki, Motosuke Tsutsumi, Kohei Otomo, Takashi Murata, Noriyoshi Yagi, Masayoshi Nakamura, Tomomi Nemoto, Mitsuyasu Hasebe, Yoshihisa Oda
Current Biology 29, 1-11 DOI:10.1016/j.cub.2019.09.049
Press release (In Japanese only)
Cytokinesis is fundamental for cell proliferation. In plants, a bipolar short-microtubule array forms the phragmoplast, which mediates vesicle transport to the midzone and guides the formation of cell walls that separate the mother cell into two daughter cells. The phragmoplast centrifugally expands toward the cell cortex to guide cell-plate formation at the cortical division site. Several proteins in the phragmoplast midzone facilitate the anti-parallel bundling of microtubules and vesicle accumulation. However, the mechanisms by which short microtubules are maintained during phragmoplast development, in particular, the behavior of microtubules at the distal zone of phragmoplasts, are poorly understood. Here, we show that a plant-specific protein, CORTICAL MICROTUBULE DISORDERING 4 (CORD4), tethers the conserved microtubule-severing protein katanin to facilitate formation of the short-microtubule array in phragmoplasts. CORD4 was specifically expressed during mitosis and localized to preprophase bands and phragmoplast microtubules. Custom-made two-photon spinning disk confocal microscopy revealed that CORD4 rapidly localized to microtubules in the distal phragmoplast zone during phragmoplast assembly at late anaphase and persisted throughout phragmoplast expansion. Loss of CORD4 caused abnormally long and oblique phragmoplast microtubules and slow expansion of phragmoplasts. The p60 katanin subunit, KTN1, localized to the distal phragmoplast zone in a CORD4-dependent manner. These results suggest that CORD4 tethers KTN1 at phragmoplasts to modulate microtubule length, thereby accelerating phragmoplast growth. This reveals the presence of a distinct machinery to accelerate cytokinesis by regulating the action of katanin.
Source: Sasaki et al., (2019) Current Biology 29, 1-11, DOI: 10.1016/j.cub.2019.09.049
Microfocus X-ray CT (microCT) Imaging of Actinia equina (Cnidaria), Harmothoe sp. (Annelida), and Xenoturbella japonica (Xenacoelomorpha).
Maeno A, Kohtsuka H, Takatani K, Nakano H.
Journal of Visualized Experiments 150 e59161 1-9 DOI:10.3791/59161
Traditionally, biologists have had to rely on destructive methods such as sectioning in order to investigate the internal structures of opaque organisms. Non-destructive microfocus X-ray computed tomography (microCT) imaging has become a powerful and emerging protocol in biology, due to technological advancements in sample staining methods and innovations in microCT hardware, processing computers, and data analysis software. However, this protocol is not commonly used, as it is in the medical and industrial fields. One of the reasons for this limited use is the lack of a simple and comprehensible manual that covers all of the necessary steps: sample collection, fixation, staining, mounting, scanning, and data analyses. Another reason is the vast diversity of metazoans, particularly marine invertebrates. Because of marine invertebrates’ diverse sizes, morphologies, and physiologies, it is crucial to adjust experimental conditions and hardware configurations at each step, depending on the sample. Here, microCT imaging methods are explained in detail using three phylogenetically diverse marine invertebrates: Actinia equina (Anthozoa, Cnidaria), Harmothoe sp. (Polychaeta, Annelida), and Xenoturbella japonica (Xenoturbellida, Xenacoelomorpha). Suggestions on performing microCT imaging on various animals are also provided.
Source: Maeno A. et al, (2019) J Vis Exp. 6 Augst, DOI:10.3791/59161.
Inquiries : Technical Specialist, MAENO, Akiteru(amaeno@nig.ac.jp)
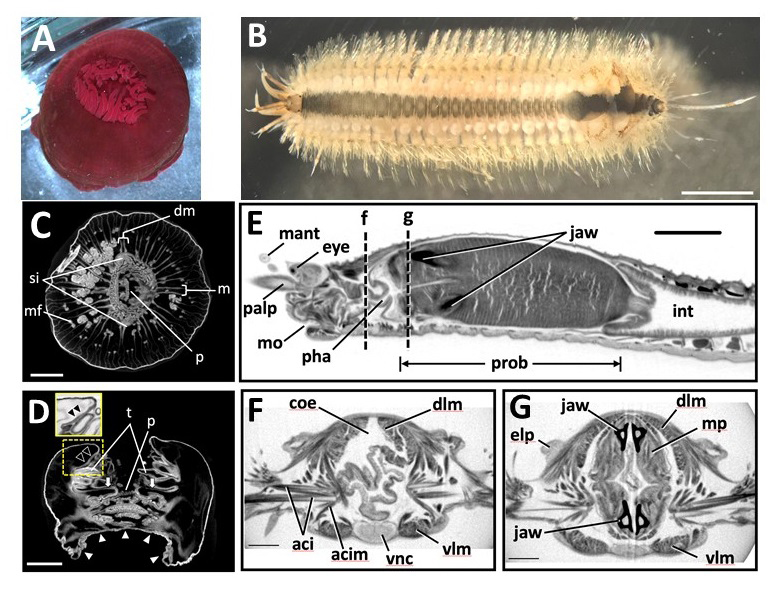
Figure: Marine invertebrate animals observed in this study. (A,B)
(A) Live anesthetized Actinia equina (Anthozoa, Cnidaria).
(B) Live anesthetized Harmothoe sp. (Polychaeta, Annelida).Most of the elytra were already missing at this stage, with only four remaining near the posterior end. Scale bars = 3 mm.
Scanned and reconstructed images of marine invertebrates. (C-G)
(C) Transverse and (D) longitudinal sections of Actinia equina. Scale bars in C, D = 3 mm.
(E-G) Harmothoe sp. (Polychaeta, Annelida). (E) Sagittal section of the anterior part. (F, G) Transverse section at the dotted lines f and g in (E). Scale bars: E = 1 mm; F, G = 0.3 mm.
Volume rendering image and transverse section movie of the whole body of Harmothoe sp. 6 sec to 16 sec: 3D volume rendering image. Top: left view, bottom: frontal view. 17 sec to 1min 42 sec: Transverse section movie. The position of the section is shown with a moving green line on the sagittal section image at top. From 17 sec to 53 sec, transverse section movie of the anterior part of the specimen generated from Pinpoint Scan is shown at the left bottom. From 1 min 7 sec to 1 min 14 sec, a 3D model made using Imaris software showing the positions of major organs is present at right top. Anatomical supervision: Masaatsu Tanaka (Kagoshima University)
This technique is one of the bases of following researches.
・ Evolution of Shh endoderm enhancers during morphological transition from ventral lungs to dorsal gas bladder
・ Regulation of internode patterning and vein anastomosis in maize stems.
・ Combination of multiple Shh enhancers controls tooth development in mouse
・Development of organs in living whole embryo/larval grafts in zebrafish
・ Enhancer adoption changes limb morphology
・When do male and female differences appear in the development of beetle horns? (National Institute for Basic Biology )
・A mouse model of human chromosomal disorder, partial trisomy distal 4q
A Novel Birthdate-Labeling Method Reveals Segregated Parallel Projections of Mitral and External Tufted Cells in the Main Olfactory System
Tatsumi Hirata, Go Shioi, Takaya Abe, Hiroshi Kiyonari, Shigeki Kato, Kazuto Kobayashi, Kensaku Mori and Takahiko Kawasaki
eNeuro 31, ENEURO.0234-19.2019, 2019 DOI:10.1523/ENEURO.0234-19.2019
Odorant receptors form an ordered odorant map on the main olfactory bulb. This spatial representation disappears in most subsequent targets by “diffuse divergence and random convergence” of olfactory bulb projections. We revisited these projections using a newly developed method that can genetically dissect distinct subsets of olfactory bulb projection neurons based on their neuronal birthdates. Our birthdate tag analysis exposed parallel segregated projections formed by early-born mitral and late-born external tufted cells in otherwise apparently random olfactory networks. The results suggest that these parallel pathways extract unique features of information from the common olfactory input and process these features in a way similar to “color”, “orientation” or “direction” in the visual system. Importantly, the birthdate tag method can pave the way for deciphering the functional meaning of these individual pathways in the future.
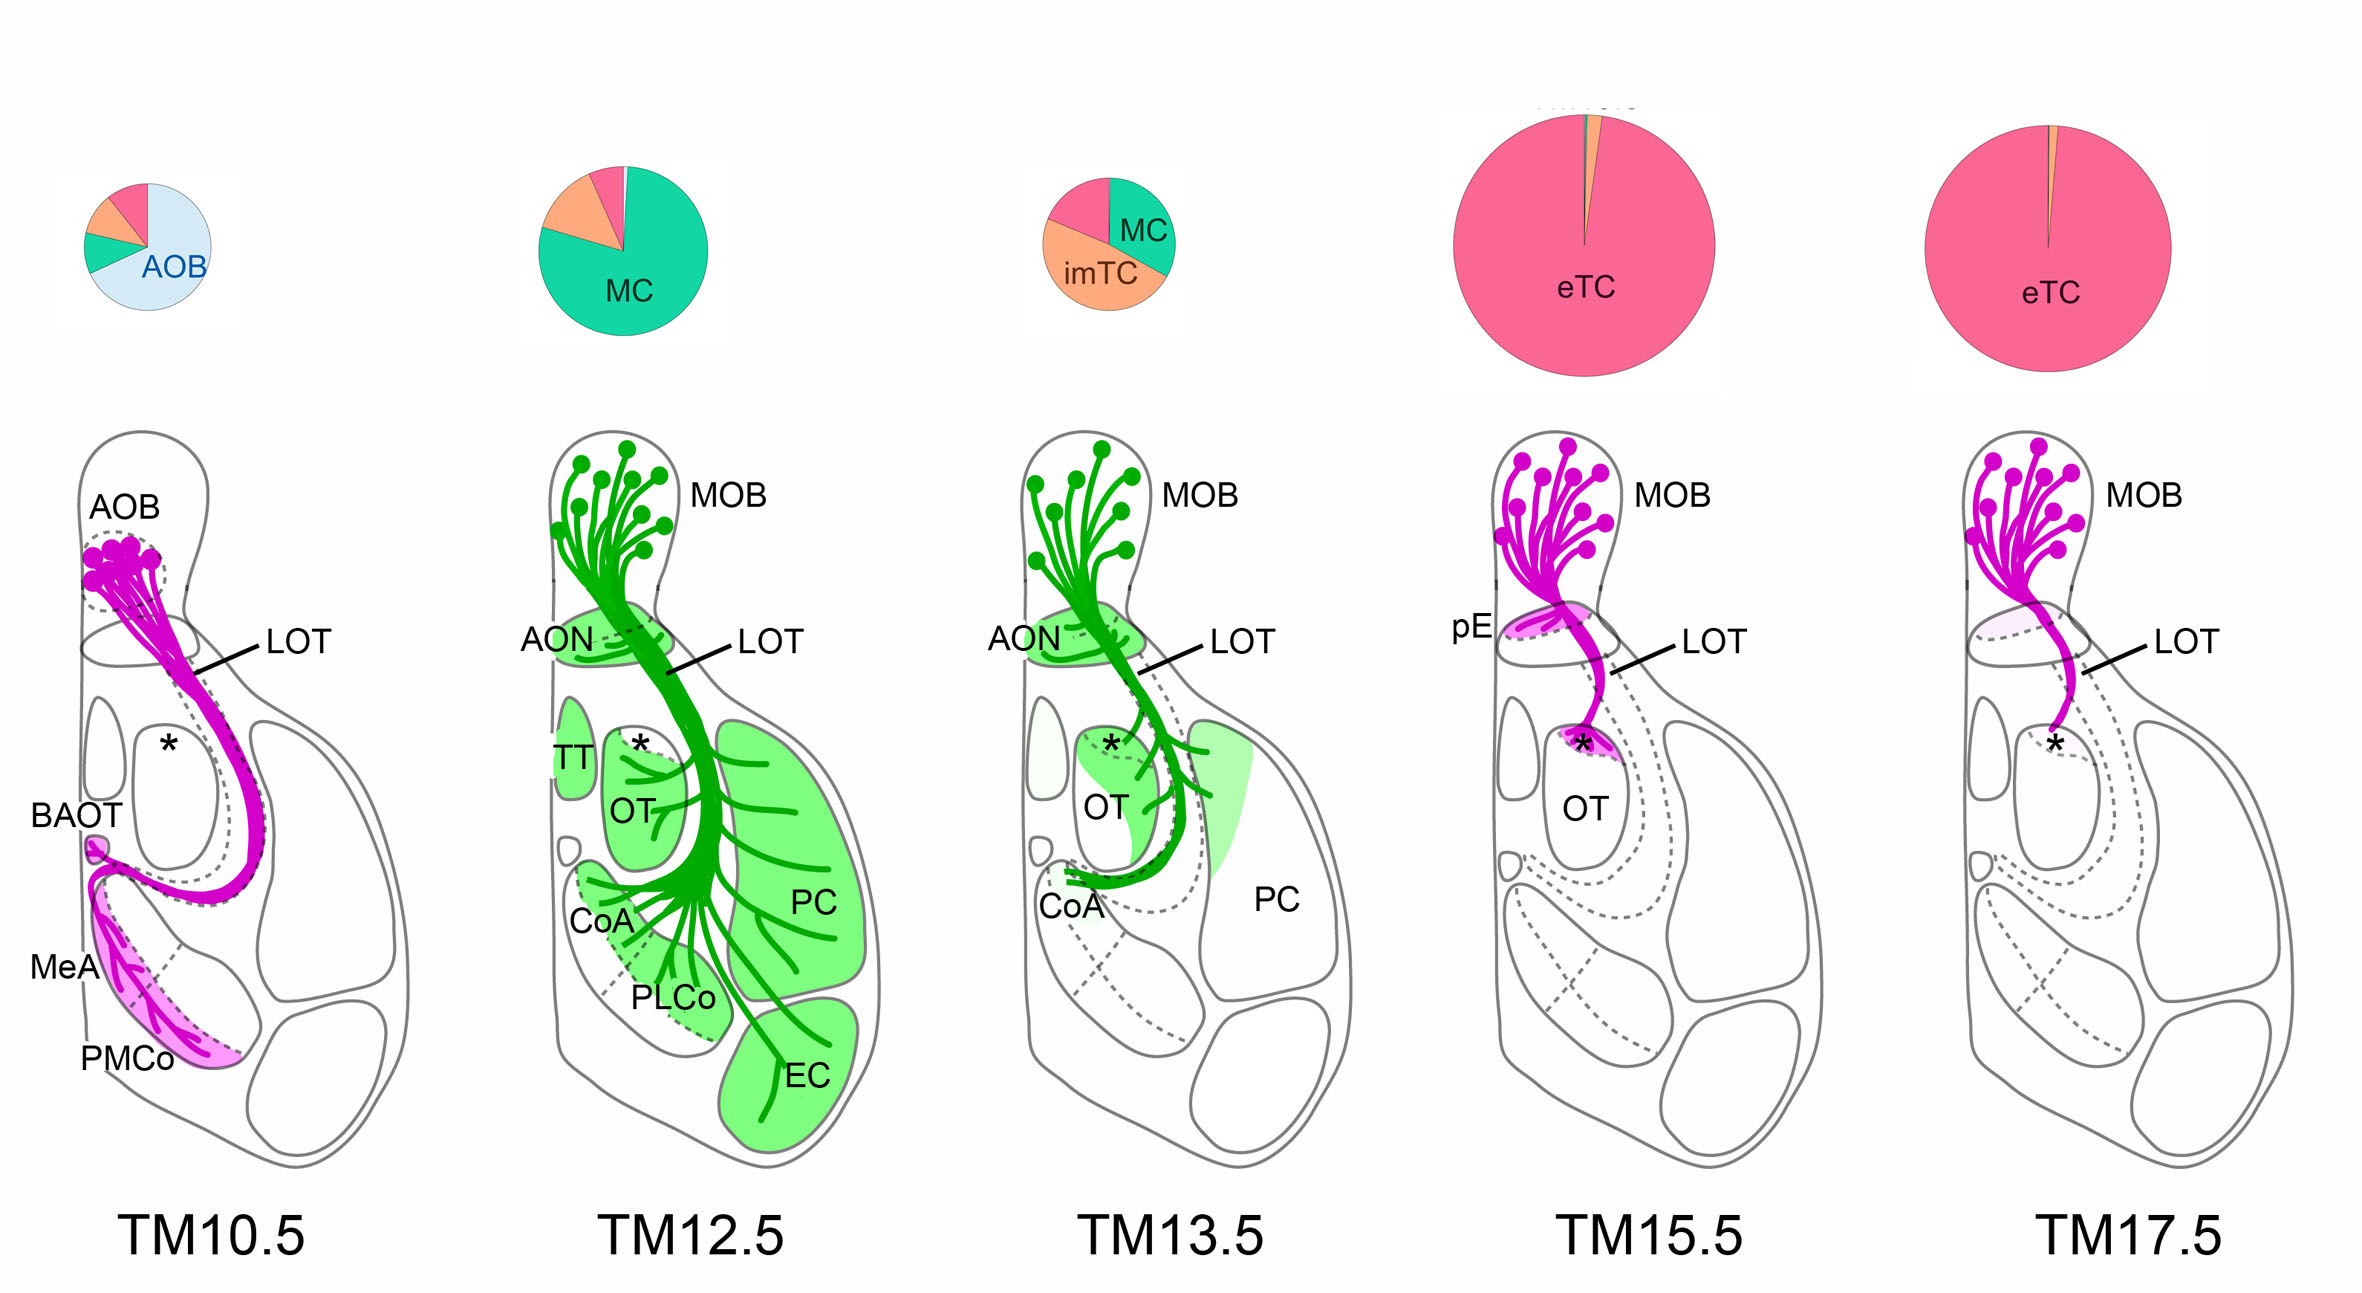
Figure: Dissection of olfactory bulb projection neurons and their axon trajectories using neuronal birthdate tagging
Depending on tamoxifen injection stages (TM10.5~17.5), different classes of neurons such as accessory olfactory bulb neurons (AOB), mitral cells (MC) or tufted cells (TC) are tagged (pie charts), and their axon trajectories are revealed (bottom diagrams).