
Press release
TRsv: simultaneous detection of tandem repeat variations, structural variations, and short indels using long read sequencing data.
Shunichi Kosugi, Chikashi Terao
Genome Biology 26, Article number: 246 (2025) DOI:10.1186/s13059-025-03718-z
![]() Press release (In Japanese only)
Press release (In Japanese only)
Tandem repeat copy number variations (TR-CNVs), structural variations (SVs), and short indels have been responsible for many diseases and traits, but no tools exist to distinguish and detect these variants. In this study, we developed a computational tool, TRsv, to distinguish and detect TR-CNVs, SVs, and short indels using long reads. In evaluation with simulated and real datasets, TRsv outperformed existing tools for detection of TR-CNVs and indels, and performed equally well for detection of SVs. We demonstrated genome-wide detection of TR-CNVs, including variants associated with gene expression, disease, and quantitative traits, using 160 long-read whole genome sequencing data and TRsv.
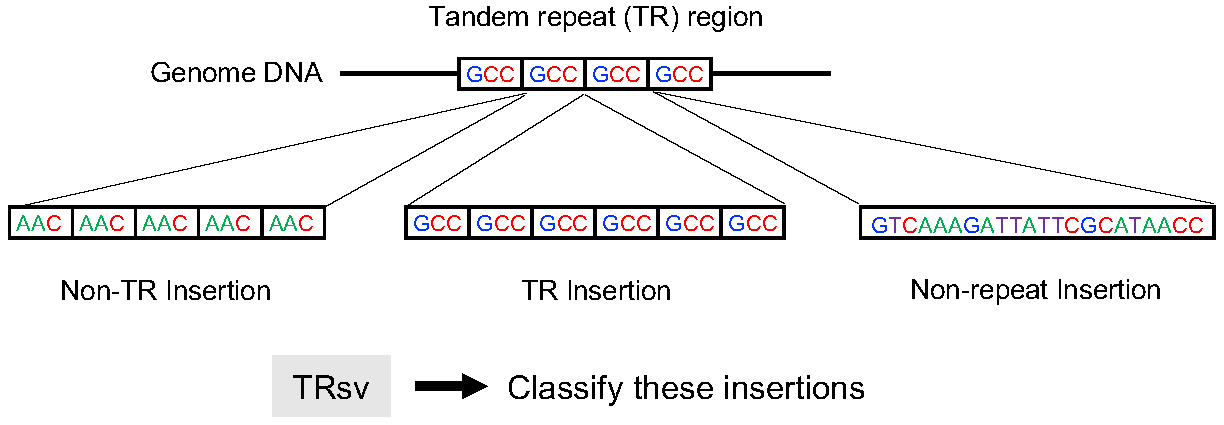
Fig. 1: TRsv distinguishes different types of insertions observed within tandem repeat regions
Within tandem repeat (TR) regions, TR insertions consisting of the same repeat unit as the TR region (GCC in the example figure) are often observed, but insertions consisting of different repeat units (non-TR repeat insertions) and insertions without repeats (non-repeat insertions) are also frequently observed. TRsv distinguishes and identifies these different types of insertions.
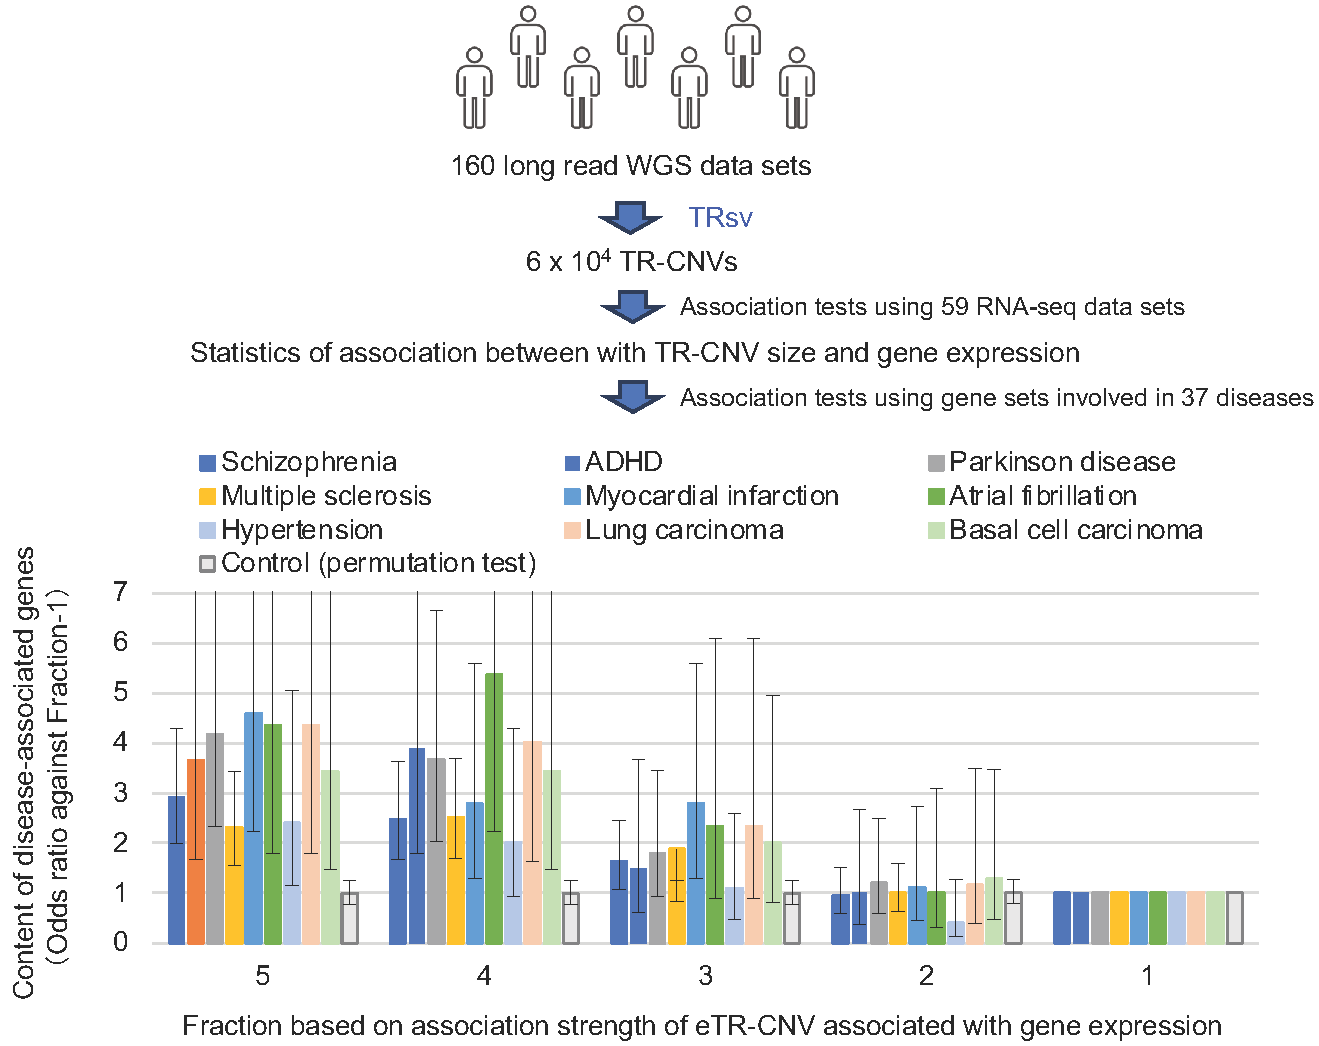
Fig. 2: TRsv identifies TR-CNVs associated with expression of disease-associated genes
The correlations between the sizes of TR-CNVs and gene expression levels were tested using 6 x 10⁴ TR-CNVs detected with TRsv and 160 long read whole genome sequencing data and 59 matched RNA-seq data. The associated genes were fractionated into 5 equal fractions from 5 to 1 in order of correlation strength (horizontal axis). The proportion of disease-associated genes in each fraction was calculated, and the ratio of the content of each fraction to the content of disease-associated genes in the fraction with correlation strength 1 (odds ratio) was plotted for each disease (vertical axis). As a control, odds ratios for a randomly selected set of 800 genes from 20,000 human genes are shown. The black lines on the bars indicate standard errors. This result indicates that the expression of genes involved in many diseases is regulated by TR-CNVs and suggest that disease development is affected by TR-CNVs.