
Division of Brain Function • Hirata Group
A common developmental plan for neocortical gene-expressing neurons in the pallium of the domestic chickenGallus gallus domesticus and the Chinese softshell turtle Pelodiscus sinensis.
I. K. Suzuki and T. Hirata Front. Neuroanat.(2014) 8 20 doi: 10.3389/fnana.2014.00020The highly evolved neocortex is a marked characteristic of mammals. It develops as layers, in which neurons are sequentially added from deep to the surface in a birth-order-dependent manner. Evolutionary processes of the layered neocortex have been a long mystery. We recently reported that the chicken brain contains neuron subtypes that are similar to deep and upper layer neurons in the mammalian neocortex . However, the comparison of only two distant animal groups was not sufficient to specify potential evolutional changes, and similar analyses of other animal groups have been awaited. In this study, we performed gene expression analyses in the softshell turtle brain, which is often referred to as an ancestral form of amniote brains. The turtle brain contains a single neuronal layer, exhibiting a clear difference from the chicken brain. Our expression analyses of orthologs of neocortical layer marker genes highlighted similarities in neuronal arrangements between the two species. Specifically, in both of the species, deep layer neurons are positioned in the medial part, whereas upper layer neurons are positioned in the lateral part. Thus, this medio-lateral neuronal arrangement appears to be an ancestral mode in sauropsids. The results support our hypothesis of an ancient origin of neocortical neuron subtypes. We assume that the generality of birth-order-dependent mechanisms for specification of neuron subtypes probably underlies the their unexpected conservation among diverse amniote species.
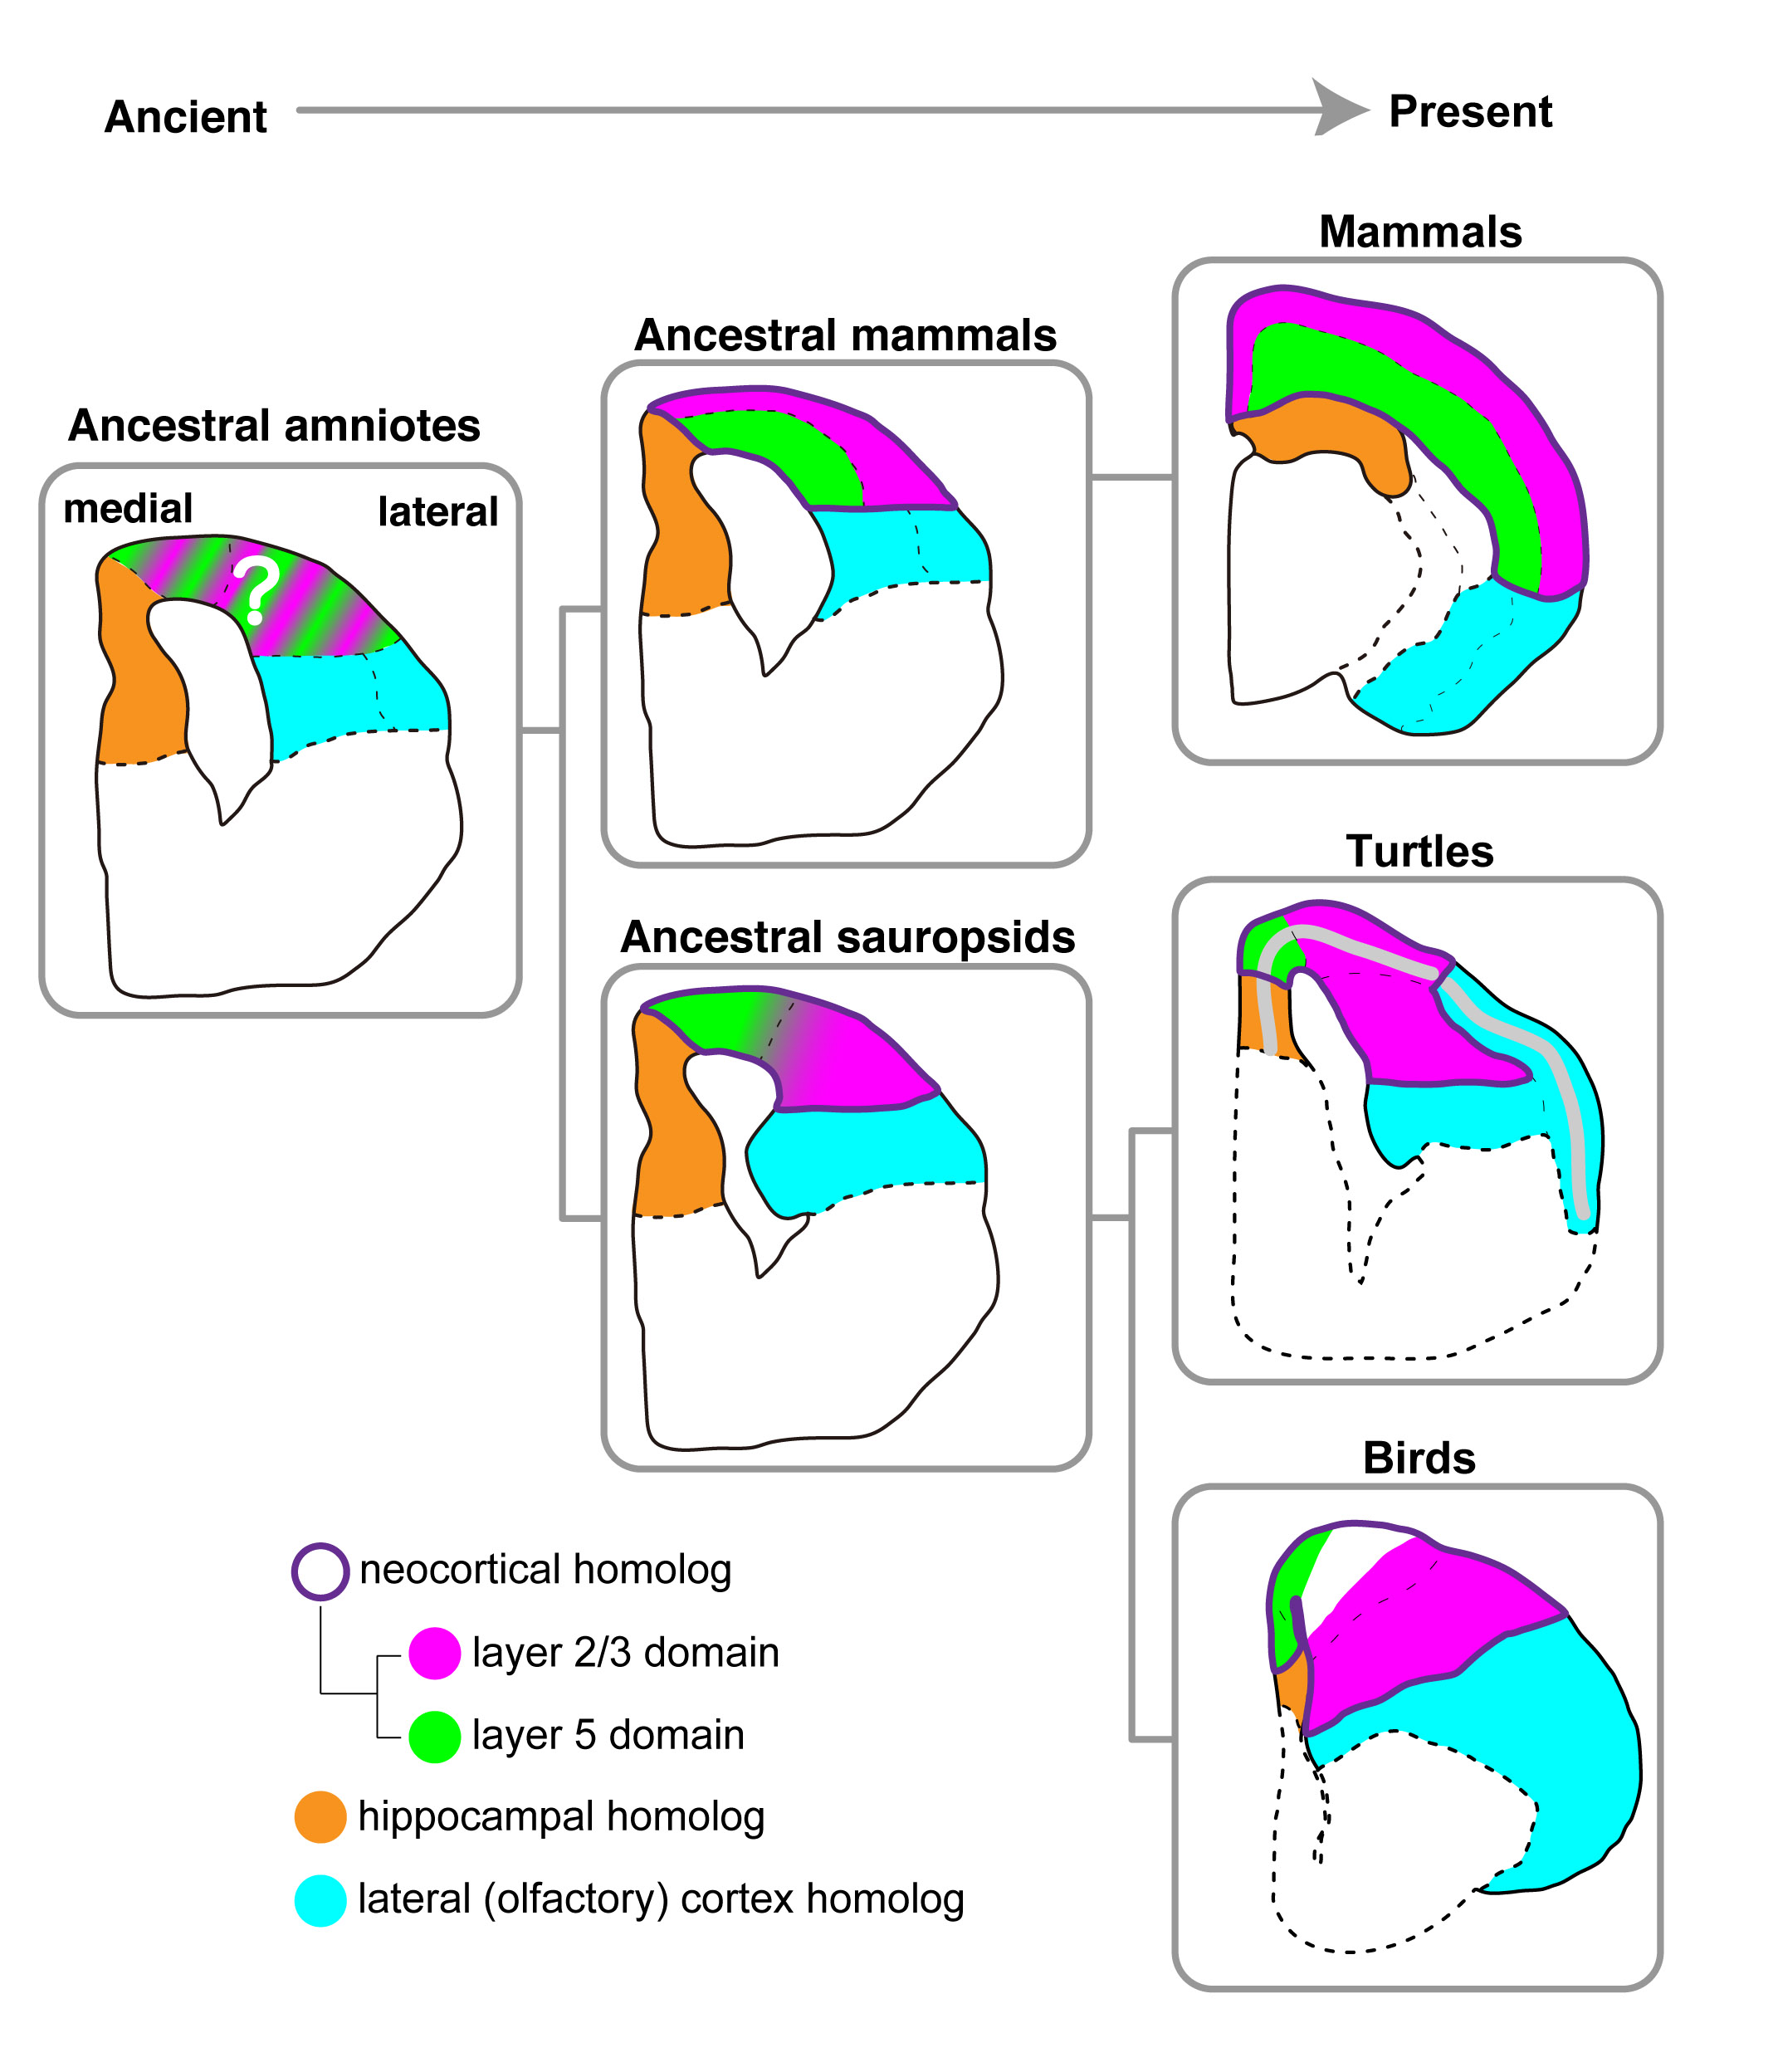
Evolutionary model of brains in amniotes
Press release
A male-specific QTL for social interaction behavior in mice mapped with automated pattern detection by a hidden Markov model incorporated into newly developed freeware
Toshiya Arakawa1, Akira Tanave1, Shiho Ikeuchi, Aki Takahashi, Satoshi Kakihara, Shingo Kimura, Hiroki Sugimoto, Nobuhiko Asada, Toshihiko Shiroishi, Kazuya Tomihara, Takashi Tsuchiya, Tsuyoshi Koide. ※1 equally contributed.
Journal of Neuroscience Methods Available online 21 April 2014 doi:10.1016/j.jneumeth.2014.04.012
Notwithstanding the importance of effective approaches to analyze social interaction between animals in experimental settings, the methods that are currently available to do this rely predominantly on human observation. This makes large-scale studies of social interaction behavior difficult.
In this paper, we report the development of freeware, called DuoMouse, that enables video recording to track the movements of two mice from a movie file, analysis of behavioral states using a hidden Markov model (HMM), and visualization of the results. We used this software to compare social behavior in consomic and subconsomic strains, and to map a genetic locus responsible for differences in social interaction between the strains. We report a locus that increases social interaction only in males and that lies within a 24.6-Mb region of chromosome 6.
We propose that the method applied in the present study is very efficient and useful for large-scale genetic and pharmacological studies of social behavior in mice. All of the software is open-source, and the source code will also be provided for further development by others.
(https://zenodo.org/records/12577797)
This research was supported by the Research Organization of Information and Systems, Transdisciplinary Research Integration Center, JSPS KAKENHI Grant Numbers 23650243 and 25116527, and NIG Cooperative Research Program (2010-A40, 2012-A85).
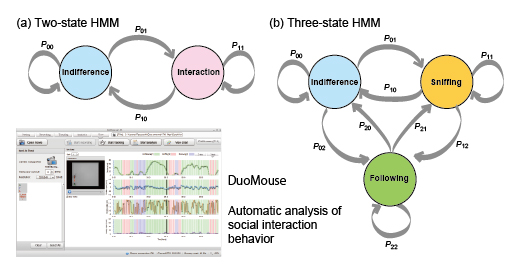
Diagram showing the Markov transition probabilities for the two-state HMM and three-state HMM. The image showing one of the pages of the freeware, DuoMouse.
Division of Molecular and Developmental Biology • Kawakami Group
Development of the lateral line canal system through a bone remodeling process in zebrafish.
Hironori Wada, Miki Iwasaki, Koichi Kawakami Dev. Biol., in press, doi: 10.1016/j.ydbio.2014.05.004The lateral line system of teleost fish is composed of mechanosensory receptors (neuromasts), some of which are superficial whereas others are embedded in canals running under the skin. Canal diameter and size of canal neuromasts are correlated with increasing body size, thus providing a very simple system to investigate the mechanism underlying the coordination between organ growth and body size. Here, we examine the development of the trunk lateral line canal system in zebrafish. We demonstrate that trunk canals originate from scales through a bone remodeling process. We suggest that the bone remodeling process is essential for normal growth of canals and of canal neuromasts. Moreover, we show that the presence of lateral line cells is required for the formation of canals, suggesting the existence of mutual interactions between the sensory system and surrounding connective tissues.
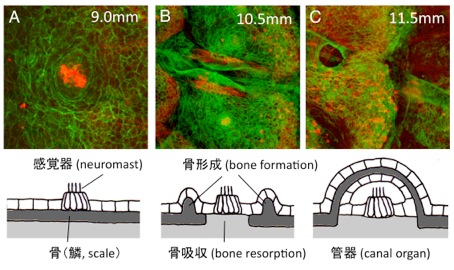
(A) The lateral line sense organ, the neuromast, is located on the skin surface in embryonic stages. (B) When fish undergo metamorphosis, a pair of ridges extends outward from the scale. At the same time, bony elements under the neuromast gradually disappear. (C) The neuromast becomes embedded in the canal running under the scale in adult fish.
Genome Informatics Laboratory • Nakamura Group Division of Cytogenetics • Kobayashi Group
Mudi, a web tool for identifying mutations by bioinformatics analysis of whole-genome sequence.
Naoko Iida, Fumiaki Yamao, Yasukazu Nakamura, and Tetsushi Iida Genes to Cells 28 APR 2014 DOI:10.1111/gtc.12151Genetics is a powerful approach to discovery of the molecular mechanisms underlying biological phenomena. However, experiments for identification of mutations by classical genetics is a time-consuming and laborious process. Modern whole-genome sequencing, coupled with bioinformatics analysis, has enabled fast and cost-effective mutation identification. However, for many experimental researchers, bioinformatics analysis is still a difficult aspect of whole-genome sequencing. To address this issue, we developed a browser-accessible and easy-to-use bioinformatics tool called Mutation discovery (Mudi; http://naoii.nig.ac.jp/mudi_top.html). Users can run Mudi analysis with ‘one-click’ operation in a web browser after uploading genome resequencing data. Mudi simplifies analysis of whole-genome sequencing and thereby expands the possibilities for systematic forward-genetic approaches in various organisms.
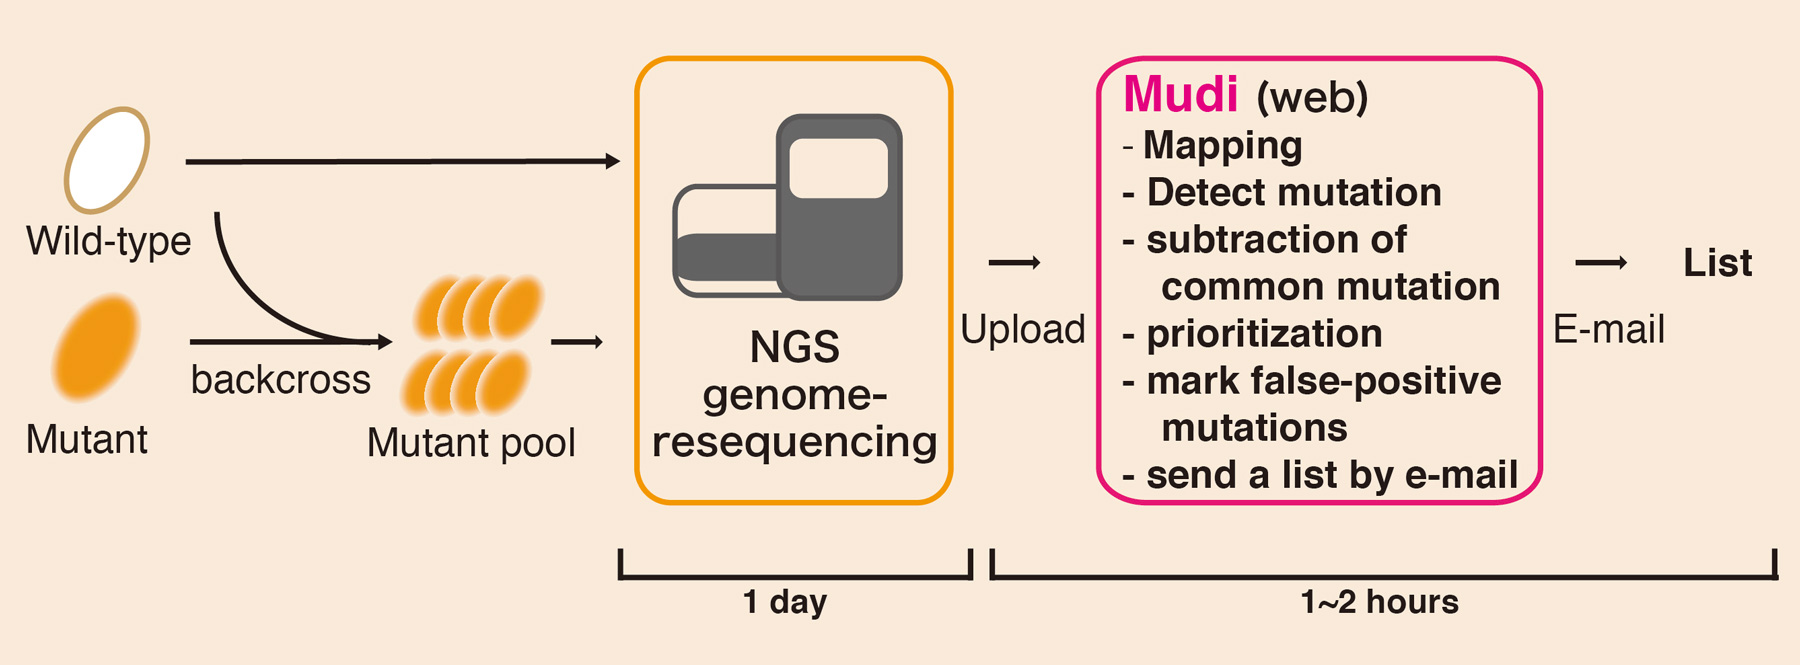
Workflow of “Mudi” system. Genomic DNA is prepared from pooled mutants by pooled-linkage analysis. Mudi calls prioritized mutation candidates by bioinformatics analysis using genome-resequencing data.
Mouse Genomics Resource Laboratory (MGRL) • Koide Group
Segregation of a QTL cluster for home-cage activity using a new mapping method based on regression analysis of congenic mouse strains
Shogo Kato, Ayako Ishii, Akinori Nishi, Satoshi Kuriki, Tsuyoshi Koide Heredity. advance online publication 30 April 2014; doi:10.1038/hdy.2014.42Genetic mapping using congenic strains is one of the most powerful methods available to show the existence of QTLs in the genomic regions substituted into recipient strains. In this case, genetic mapping can be conducted by making a series of congenic strains that cover genomic regions that partially overlap with the adjacent congenic strains. In the analysis of the phenotype using a series of congenic strains, however, the phenotype shows a variety of levels, which indicates the existence of multiple QTLs in the mapped chromosomal regions. These results show that the precise genetic mapping of fine QTLs is extremely difficult using current methods.
Dr. Tsuyoshi Koide’s group collaborated with Drs. Shogo Kato and Satoshi Kuriki in the Institute of Statistical Mathematics and established a new method for mapping multiple QTLs using data from a series of congenic strains by applying a regression model for the analysis of total home-cage activity in mice. The results of the analysis identified four significant QTLs in a 14.5 Mb genomic region. Among these, three have negative effects but one has a positive effect on total home-cage activity. In further analysis of recombinants obtained from the congenic strains, we confirmed the existence of the QTL that has a positive effect on the activity as well as another QTL that suppresses the effect of this positive QTL. These results clarify for the first time the association of a complex genetic mechanism in the QTL cluster on chromosome 6 with the regulation of home-cage activity.
This work was supported by the Research Organization of Information and Systems, Transdisciplinary Research Integration Center, JSPS KAKENHI (Grant Numbers 23650243 and 25116527), and Yamada Science Foundation.
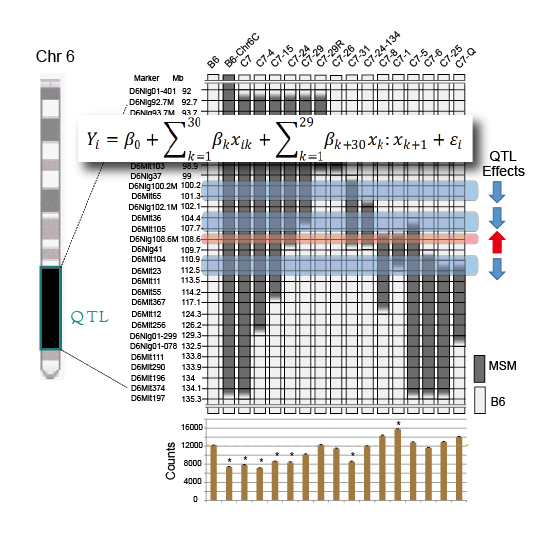
A cluster of four QTLs for behavior segregated by new method using a statistical regression model. The data of genomic regions carried in the congenic strains as well as the data of home-cage activity exhibited by congenic strains are analyzed with regression model. The study revealed four QTLs which are clustered in a small genomic region.