A sugar utilization phenotype contributed to the formation of genetic exchange communities in the ecological niches among lactic acid bacteria.
Arita Group / Biological Networks Laboratory

A sugar utilization phenotype contributes to the formation of genetic exchange communities in lactic acid bacteria
Shinkuro Takenaka, Takeshi Kawashima, Masanori Arita.
FEMS Microbiology Letters (2021) 368, fnab117 DOI:10.1093/femsle/fnab117
In prokaryotes, a major contributor to genomic evolution is the exchange of genes via horizontal gene transfer (HGT). Areas with a high density of HGT networks are defined as genetic exchange communities (GECs). Although some phenotypes associated with specific ecological niches are linked to GECs, little is known about the phenotypic influences on HGT in bacterial groups within a taxonomic family. Thanks to the published genome sequences and phenotype data of lactic acid bacteria (LAB), it is now possible to obtain more detailed information about the phenotypes that affect GECs. Here, we have investigated the relationship between HGT and internal and external environmental factors for 178 strains from 24 genera in the Lactobacillaceae family. We found a significant correlation between strains with high utilization of sugars and HGT bias. The result suggests that the phenotype of the utilization of a variety of sugars is key to the construction of GECs in this family. This feature is consistent with the fact that the Lactobacillaceae family contributes to the production of a wide variety of fermented foods by sharing niches such as those in vegetables, dairy products and brewing-related environments. This result provides the first evidence that phenotypes associated with ecological niches contribute to form GECs in the LAB family.
Source: S. Takenaka, et al., DOI: 10.1093/femsle/fnab117
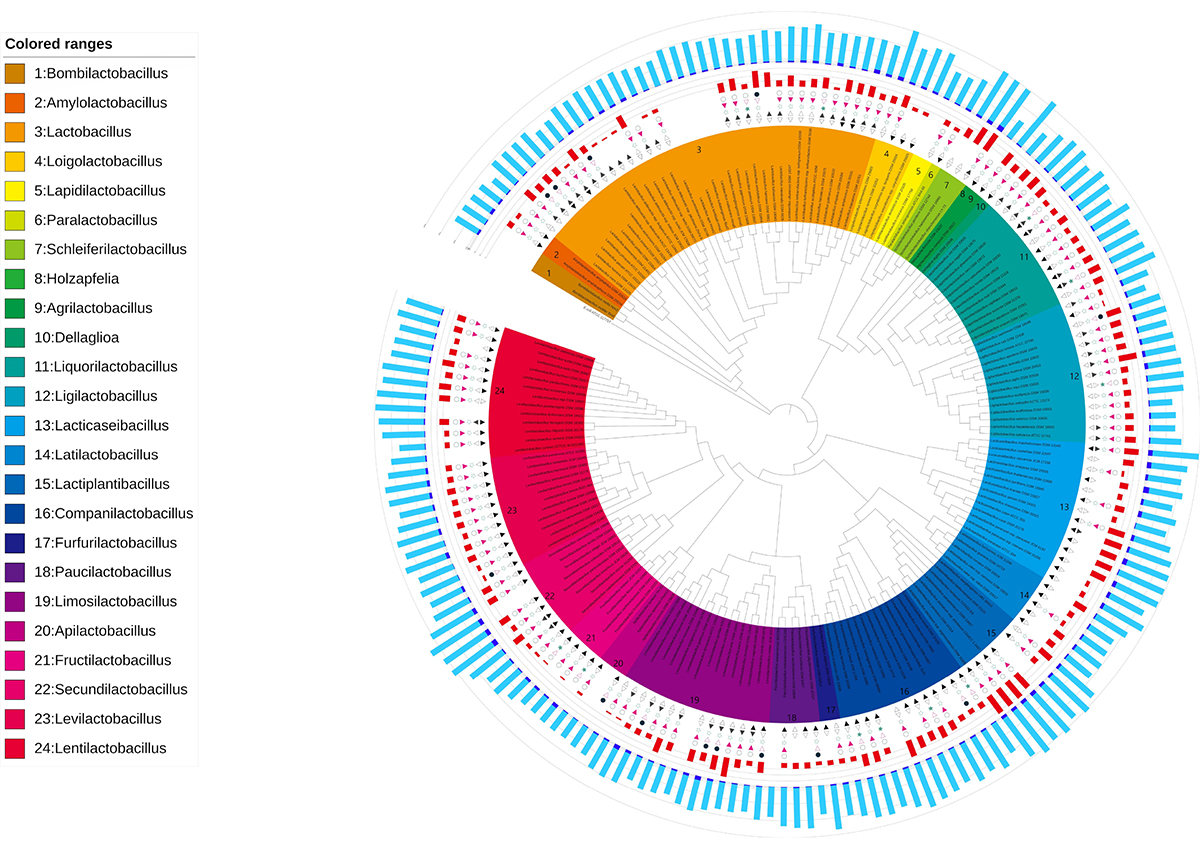
Figure at the beginning: Phylogenetic tree based on the 16S rRNA genes of the LAB strains with the phenotypic and genomic features identified. The inner band shows species colored by genus. The next five symbols show phenotypic characteristics for each LAB strain; first inward-facing triangle indicates the growth at 15°C, second outward-facing triangle indicates the growth at 45°C, third star indicates the micro aerophilic, fourth red inward-facing indicates facultatively anaerobic and fifth circle indicates obligate anaerobic. A filled symbol means the strain has the phenotype, and an open symbol means that it does not. A blank means that there is no relevant information available. The next red band shows the number of sugar types that can be utilized. The outer bands show the number of coding sequences (CDS) for each strain: navy blue indicates the estimated number of CDS acquired by the horizontal gene transfer (HGT) and light blue indicates the number of native CDS.

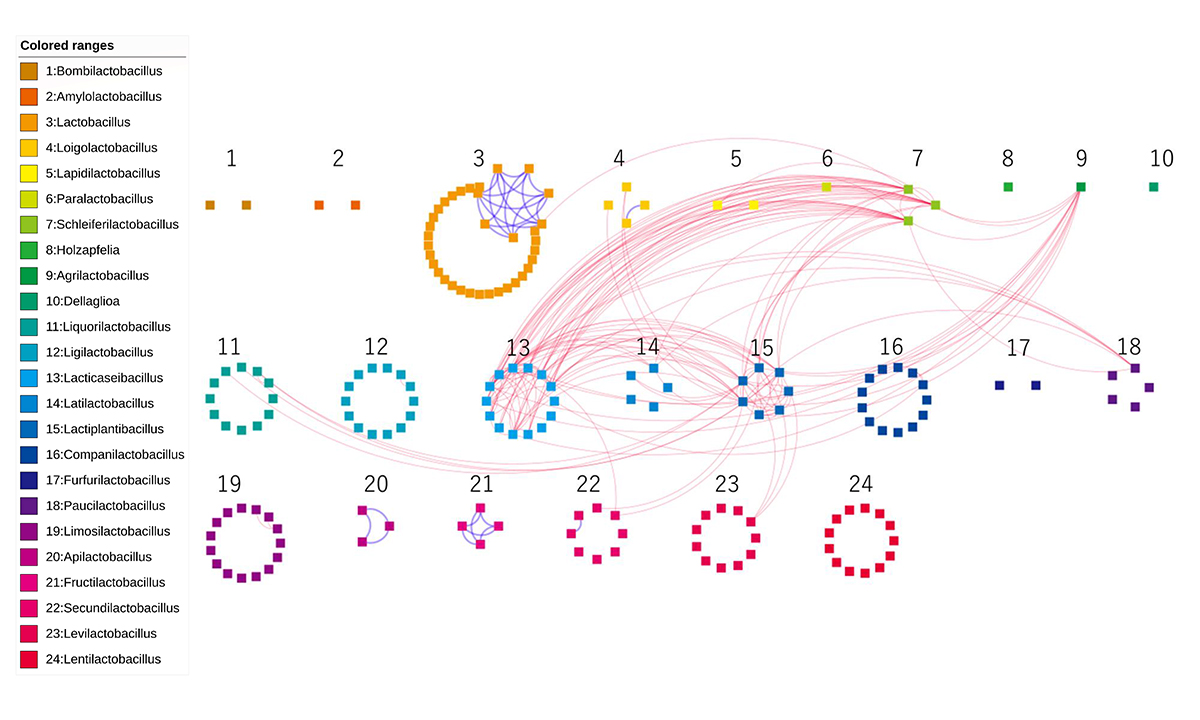
Figure: The networks for the generalist and specialist group orthologs. Each of the 178 nodes represents an LAB genome, which are colored and numbered by genus. Edges of dotted-red/solid-blue were created between two genomes when the number of sharing generalist/specialist group orthologs was more than five.


