
Biological Macromolecules Laboratory / Maeshima Group
Density imaging of heterochromatin in live cells using orientation-independent-DIC microscopy
Ryosuke Imai, Tadasu Nozaki, Tomomi Tani, Kazunari Kaizu, Kayo Hibino, Satoru Ide, Sachiko Tamura, Koichi Takahashi, Michael Shribak, and Kazuhiro Maeshima
Molecular Biology of the Cell, 2017 DOI:10.1091/mbc.E17-06-0359
In eukaryotic cells, highly condensed inactive/silenced chromatin has long been called “heterochromatin.” However, recent research suggests that such regions are in fact not fully transcriptionally silent, and that there exists only a moderate access barrier to heterochromatin. To further investigate this issue, it is critical to elucidate the physical properties of heterochromatin such as its total density in live cells. Here, using orientation-independent differential interference contrast (OI-DIC) microscopy, which is capable of mapping optical path differences, we investigated the density of the total materials in pericentric foci, a representative heterochromatin model, in live mouse NIH3T3 cells. We demonstrated that the total density of heterochromatin (208 mg/mL) was only 1.53-fold higher than that of the surrounding euchromatic regions (136 mg/mL) while the DNA density of heterochromatin was 5.5- to 7.5-fold higher. This surprisingly small difference may be due to that non-nucleosomal materials (proteins/RNAs)(∼120 mg/mL) are dominant in both chromatin regions. Monte Carlo simulation suggested that non-nucleosomal materials contribute to creating a moderate access barrier to heterochromatin, allowing minimal protein access to functional regions. Our OI-DIC imaging offers insight into the density of live cellular environments.
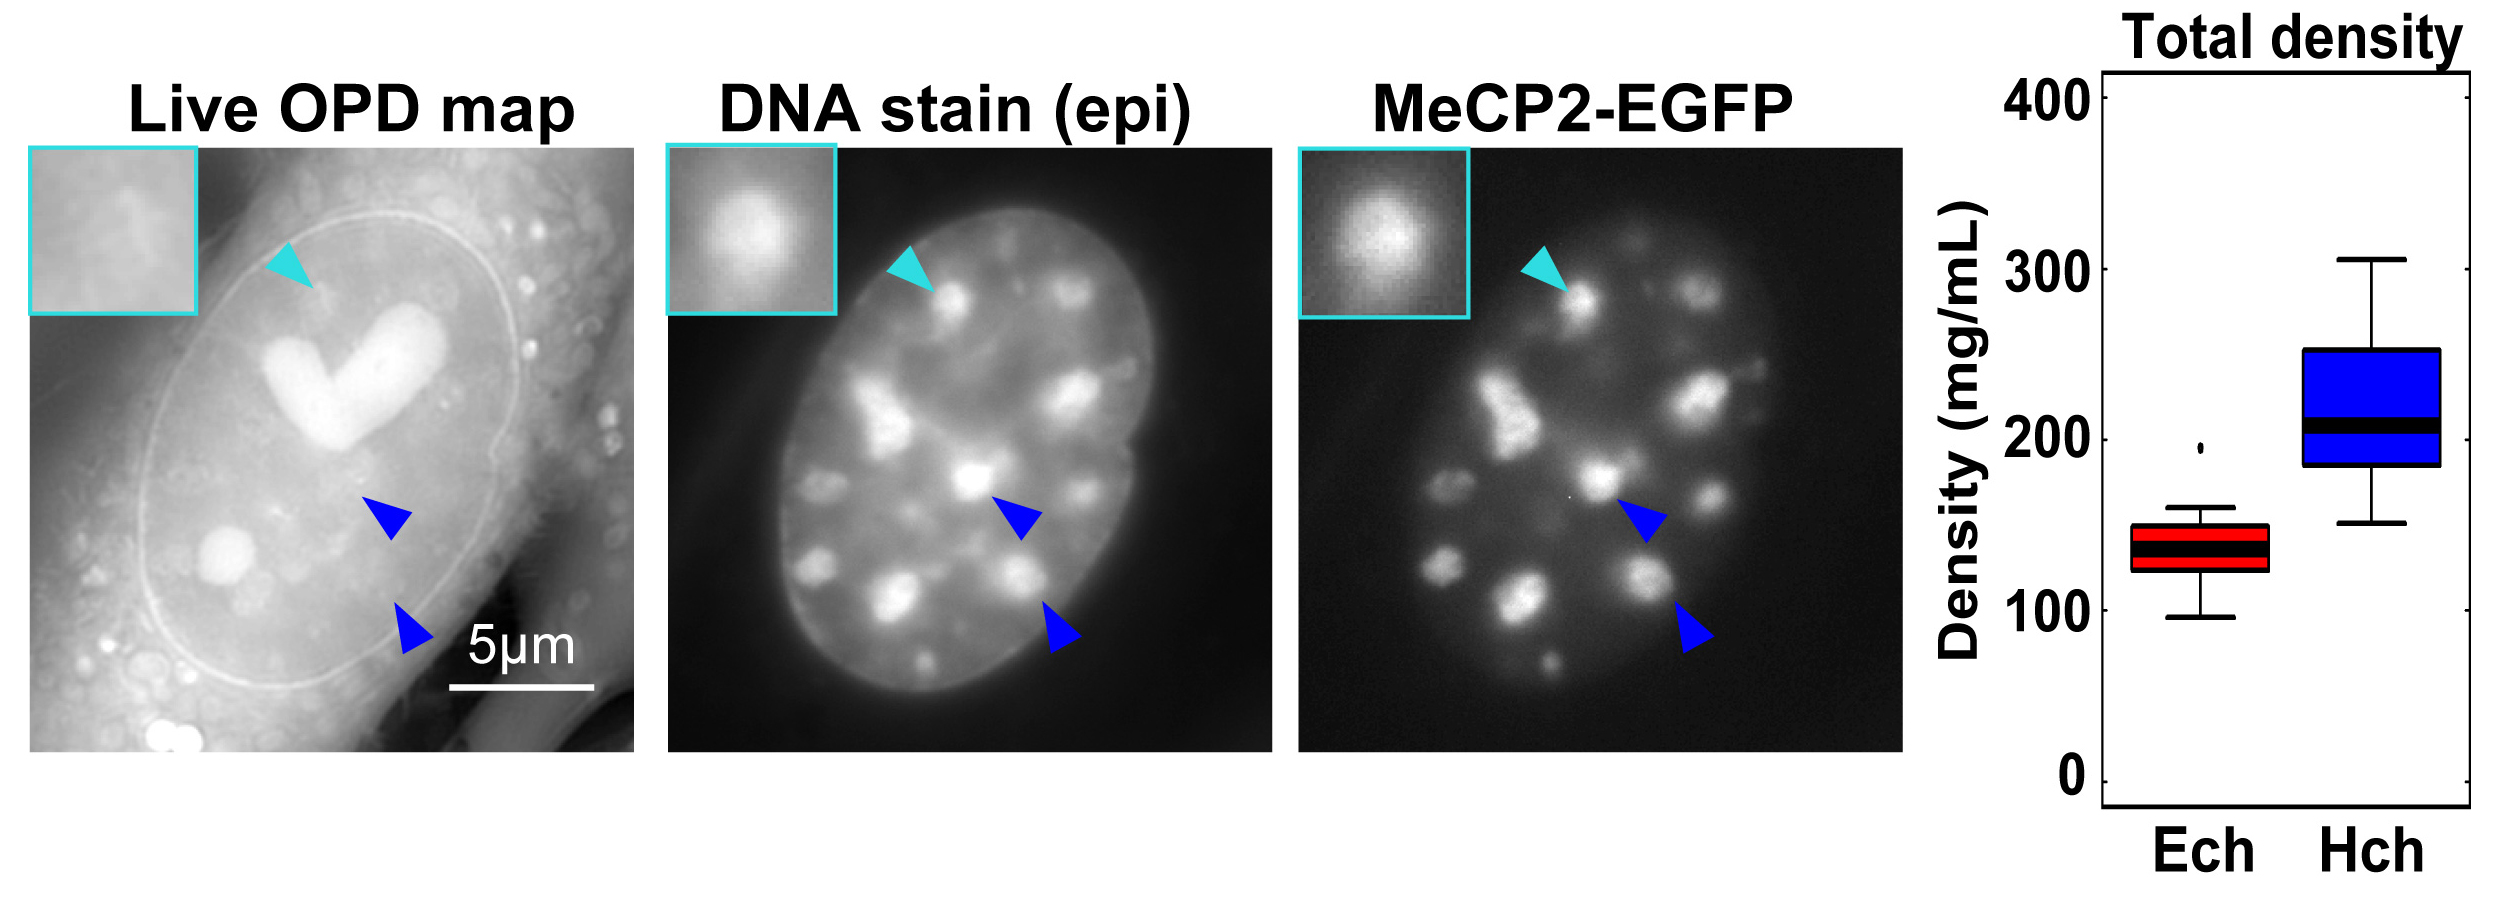
Typical images of the Optical Path Distance (OPD) map (reflecting density at each pixel) by OI-DIC, DNA staining, and MeCP2-EGFP (heterochromatin marker) signals in live NIH3T3 cells. Large foci seen in DNA staining and MeCP2-EGFP images (arrowheads) were assumed to be heterochromatin. Note that the OPD of the foci was similar or only slightly higher than that of the surrounding euchromatin. (Right) The analyzed total densities of pericentric heterochromatin foci (Hch, 208 mg/mL) and euchromatin (Ech, 136 mg/mL). The median density ratio between them was 1.53.