
Mammalian Development Laboratory / Saga Group
GBIQ: a non-arbitrary, non-biased method for quantification of fluorescent images
Youichirou Ninomiya*, Wei Zhao and Yumiko Saga*
Scientific Reports 6, Article number: 26454 (2016) DOI:10.1038/srep26454
(* corresponding authors)
Non-arbitrary and non-biased quantification of fluorescent images is an essential tool for the data-centric approach to biological systems. Typical application is high-content analysis, where various phenotypic changes in cellular components are measured from fluorescent image data. A standard protocol to detect cellular phenotypes is cell-segmentation, in which boundaries of cellular components, such as cell nucleus and plasma membrane, are first identified to define cell segments, then acquiring various phenotypic data of each segment. To achieve reliable outcome, cell-segmentation requires manual adjustments of many parameters; this requirement could hamper automated image processing in high-throughput workflow, whose quantification must be non-arbitrary and non-biased. As a practical alternative to the method, we developed GBIQ (Grid Based Image Quantification), which allows comparison of cellular information without identification of single cells. GBIQ divides an image with tiles of fixed size grids and records statistics of the grids with their location coordinates, minimizing arbitrary intervenes. GBIQ requires only one parameter (size of grid) to be set; nonetheless it robustly produces results suitable for further statistical evaluation. The simplicity of GBIQ allows it to be readily implemented in an automated high-throughput image analysis workflow. This work was supported by the Data Assimilation and Simulation Support Technologies project from the Research Organization of Information and Systems (ROIS) in Japan.
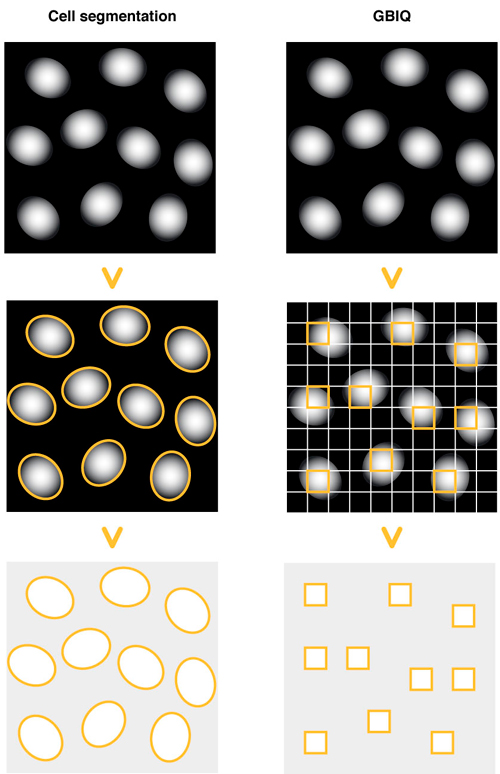
Cell segmentation: Draw outlines of cell nuclei using DNA counterstaining. Identify each outline of cell nucleus, then measure fluorescent feature of the outlines (segments).
GBIQ: Divide an image by tilling of fixed size grids. Filter certain grids that contain only cell nucleus, then measure fluorescent feature of the filtered grids.
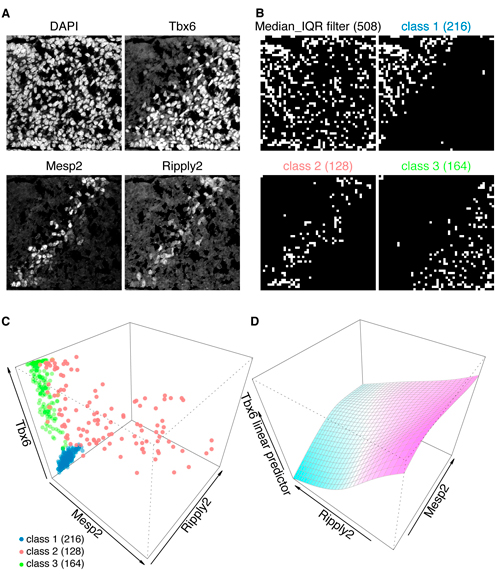
A: Triple immunofluorescent staining of developing tailbud from mouse embryo. Nuclear counterstaining by DAPI.
B and C: These immunofluorescent images (A) are processed by GBIQ with g=16. Applying the “Median_IQR filter” onto DAPI channel extracts reliable 508 observations (B, Median_IQR filter, white grids). Further applying Mclust utilizing the 3 factors (median intensities of Tbx6/Mesp2/Ripply2) onto the 508 dataset classifies them to 3 classes (C), which illustrate distinctive tissue architecture (B, class1, 2 and 3, white grids). C: All 3 factors are expressed in the class 2 (red), while neither Mesp2 nor Ripply2 expression is evident in the class 1 (blue) and class 3 (green).
D: Generalized additive model analysis of the class 2 dataset indicates negative correlation between Ripply2 and Tbx6, suggesting Ripply2 degrades Tbx6.