
Genetic Informatics Laboratory / Yamazaki Group
Transcription profile of Escherichia coli: genomic SELEX search for regulatory targets of transcription factors
Akira Ishihama, Tomohiro Shimada, and Yukiko Yamazaki
Nucleic Acids Research (2016) DOI:10.1093/nar/gkw051
Bacterial genome is transcribed by a single species of DNA-dependent RNA polymerase (RNAP). The genome transcription pattern is determined by controlling the utilization of a limited number of RNAP, of which the gene selectivity is modulated through two-steps of protein-protein interaction with two groups of regulatory protein, sigma factors with promoter recognition activity and transcription factors (TFs). The identification of regulatory targets for all these regulatory proteins is absolutely needed towards understanding the genome regulation at molecular level. Using the newly developed Genomic SELEX screening system, Ishihama, A. (NIG Emeritus Professor) and colleagues in Hosei University performed the systematic search of regulatory targets for all 7 sigma factors and all 300 transcriptions of the model prokaryote Escherichia coli. This is the first report on this line, describing the assembly and analysis of regulatory targets for the first group of TFs. The experiments have been carried out using a single and the same E. coli strain and using the same experimental systems in a single laboratory. To facilitate sharing these accumulated data sets with the research community, we compiled a database, “Transcription Profile of Escherichia coli” (TEC)(www.shigen.nig.ac.jp/ecoli/tec/). This pioneering research of identification of the whole set of regulatory targets for all regulatory proteins from a single organism will contribute for creation of a new paradigm in modern molecular genetics.
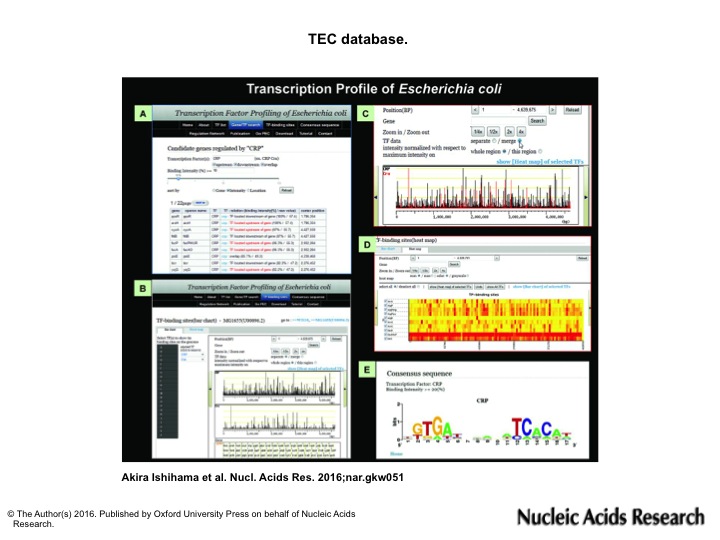
Using the TEC database, various types of analysis are possible:(A) search for the regulatory targets of TF. (B) genomic view of TF binding sites/intensity (C) comparison of binding sites between different TFs (D) heat map view of TF binding sites/intensity (E) Search for the consensus sequence of TF binding region.